
Complete Guide to Metabolic Panel Blood Tests
This blog post provides a detailed overview of common metabolic panel components and biochemical laboratory tests, grouped by functional panels. These tests play an essential role in evaluating organ function, electrolyte balance, cardiovascular risk, liver health, and more. Each section includes basic information about the analytes, how they are produced and cleared by the body, and possible medical implications of abnormal values.
If you’re also interested in hormone panels, check out our Complete Hormone Testing Guide.
Please note that this content is intended for educational and informational purposes only. It is not a substitute for medical advice, diagnosis, or treatment. For interpretation of lab results or health concerns, always consult with a qualified healthcare professional.
Explore
Renal Evaluation - Metabolic Panel
-
Urea
General Information
Urea, a component of any basic metabolic panel, is the primary nitrogenous waste product resulting from protein catabolism. Synthesized in the liver via the urea cycle, it is predominantly excreted by the kidneys.
Approximately 85% of urea is eliminated through renal excretion, with the remainder excreted via the gastrointestinal tract .
Possible Causes of Elevated Levels
• Renal Impairment: Acute or chronic kidney failure reduces urea clearance.
• High Protein Intake: Increased dietary protein elevates urea production.
• Catabolic States: Conditions like fever or corticosteroid use enhance protein breakdown, raising urea levels .
• Gastrointestinal Bleeding: Increases protein absorption, leading to higher urea production.
Possible Causes of Low Levels
• Severe Liver Disease: Impaired urea synthesis due to hepatic dysfunction.
• Malnutrition or Low Protein Intake: Decreases substrate availability for urea production.
• Overhydration: Dilutes urea concentration in the blood.
Key Notes / Suggestions
• Urea levels must be interpreted alongside other renal function tests, as they can be influenced by non-renal factors.
• Monitoring urea is essential in assessing the efficacy of dialysis and the progression of renal diseases. -
Blood Urea Nitrogen (BUN)
General Information
BUN measures the nitrogen portion of urea in the blood, serving as an indirect marker of renal function and protein metabolism.
Possible Causes of Elevated Levels
• Renal Dysfunction: Impaired kidney function reduces BUN clearance.
• Dehydration: Concentrates BUN in the bloodstream.
• High Protein Diet: Increases urea and consequently BUN levels.
• Catabolic States: Enhance protein breakdown, elevating BUN .
Possible Causes of Low Levels
• Liver Disease: Diminished urea synthesis leads to lower BUN.
• Malnutrition: Reduced protein intake decreases BUN production.
• Overhydration: Dilutes BUN concentration.
Key Notes / Suggestions
• BUN levels should be assessed in conjunction with creatinine to determine the underlying cause of renal dysfunction.
• Elevated BUN alone is not definitive for kidney disease; comprehensive evaluation is necessary. -
Creatinine (Cr)
General Information
Creatinine is a waste product of creatine phosphate metabolism in muscles. It is produced at a relatively constant rate and is primarily excreted by the kidneys, making it a reliable marker for renal function .
Possible Causes of Elevated Levels
• Renal Impairment: Reduced glomerular filtration rate (GFR) leads to creatinine accumulation.
• High Muscle Mass: Increased muscle turnover elevates creatinine production.
• Certain Medications: Drugs like cimetidine can inhibit creatinine secretion, raising serum levels .
Possible Causes of Low Levels
• Reduced Muscle Mass: Conditions like muscular dystrophy decrease creatinine production.
• Severe Liver Disease: Impairs creatine synthesis, leading to lower creatinine .
• Overhydration: Dilutes serum creatinine concentration.
Key Notes / Suggestions
• Creatinine levels can be influenced by muscle mass; hence, eGFR calculations often provide a more accurate assessment of renal function.
• Monitoring creatinine is crucial in dosing nephrotoxic drugs and assessing kidney disease progression. -
BUN/Creatinine Ratio
General Information
The BUN/Creatinine ratio aids in differentiating the causes of renal dysfunction. A typical ratio ranges from 10:1 to 20:1 .
Possible Causes of Elevated Ratio
• Pre-Renal Azotemia: Conditions like dehydration or heart failure increase BUN disproportionately to creatinine.
• High Protein Intake or GI Bleeding: Elevates BUN more than creatinine.
Possible Causes of Low Ratio
• Liver Disease: Decreases BUN production, lowering the ratio.
• Rhabdomyolysis: Increases creatinine due to muscle breakdown, reducing the ratio .
Key Notes / Suggestions
• An elevated BUN/Creatinine ratio suggests pre-renal causes, whereas a low ratio may indicate liver disease or muscle injury.
• The ratio should be interpreted in the context of clinical findings and other laboratory results. -
Glomerular Filtration Rate (GFR)
General Information
GFR quantifies the rate at which the kidneys filter blood, serving as a critical indicator of renal function. It is often estimated (eGFR) using serum creatinine levels, age, sex.
Possible Causes of Decreased GFR
• Chronic Kidney Disease: Progressive loss of nephron function reduces GFR.
• Acute Kidney Injury: Sudden decline in renal function lowers GFR.
• Hypoperfusion: Conditions like hypotension decrease renal blood flow, reducing GFR .
Possible Causes of Increased GFR
• Early Diabetic Nephropathy: Hyperfiltration phase can transiently increase GFR.
• Pregnancy: Physiological changes can elevate GFR.
Key Notes / Suggestions
• eGFR is a more accurate reflection of kidney function than serum creatinine alone.
• Regular monitoring of GFR is essential in patients with risk factors for kidney disease, such as diabetes and hypertension.
CURRENT CHRONIC KIDNEY DISEASE (CKD) NOMENCLATURE USED BY KDIGO
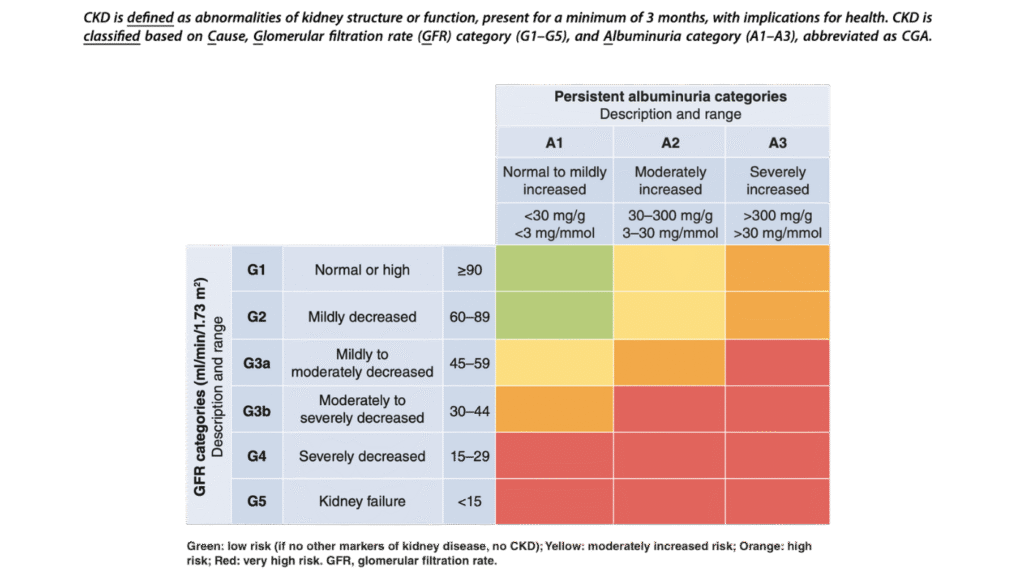
KDIGO 2024 Clinical Practice Guideline for the Evaluation and Management of Chronic Kidney Disease
Lipid Profile / Cardiovascular Risk - Metabolic Panel
A more complete metabolic panel offers more in depth information on Cardiovascular Health and risk assessment. Such tests generally include:
-
Total Cholesterol
General Information
Total cholesterol encompasses all cholesterol types in the blood, including LDL, HDL, and VLDL. It is synthesized in the liver and obtained from dietary sources.
Possible Causes of Elevated Levels
• Familial hypercholesterolemia.
• Diet high in saturated fats.
• Hypothyroidism.
• Nephrotic syndrome.
• Obstructive liver disease.
Possible Causes of Low Levels
• Malnutrition.
• Hyperthyroidism.
• Liver disease.
• Certain cancers.
Key Notes / Suggestions
While high total cholesterol is a known risk factor for cardiovascular disease, it’s essential to consider the individual components (LDL, HDL) for a more accurate risk assessment. -
High-Density Lipoprotein (HDL) Cholesterol
General Information
HDL is known as “good” cholesterol because it helps remove other forms of cholesterol from the bloodstream.()
Possible Causes of Elevated Levels
• Regular physical activity.
• Moderate alcohol consumption.
• Genetic factors.
Possible Causes of Low Levels
• Smoking.
• Obesity.
• Sedentary lifestyle.
• Type 2 diabetes.
Key Notes / Suggestions
Higher HDL levels are generally protective against heart disease. Lifestyle modifications can effectively increase HDL levels. -
Low-Density Lipoprotein (LDL) Cholesterol
General Information
LDL cholesterol is often termed “bad” cholesterol because high levels can lead to plaque buildup in arteries.
Possible Causes of Elevated Levels
• Diet High in Saturated Fats: Increases LDL production.
• Genetic Disorders: Familial hypercholesterolemia.
• Hypothyroidism: Leads to elevated LDL levels.
Possible Causes of Low Levels
• Hyperthyroidism: Increases LDL clearance.
• Malabsorption Syndromes: Reduce cholesterol absorption.
• Liver Disease: Impairs LDL production.
Key Notes / Suggestions
• Lowering LDL cholesterol is a primary target in cardiovascular disease prevention.
• Statins and other lipid-lowering agents are commonly prescribed. -
Very Low-Density Lipoprotein (VLDL) Cholesterol
General Information
VLDL transports triglycerides from the liver to peripheral tissues. It’s considered atherogenic due to its role in plaque formation.
Possible Causes of Elevated Levels
• High Carbohydrate Diets: Stimulate VLDL production.
• Insulin Resistance: Increases VLDL synthesis.
• Genetic Disorders: Familial combined hyperlipidemia.
Possible Causes of Low Levels
• Malnutrition: Decreases VLDL production.
• Hyperthyroidism: Enhances VLDL clearance.
• Liver Dysfunction: Impairs VLDL synthesis.
Key Notes / Suggestions
• VLDL levels are often estimated based on triglyceride measurements.
• Managing triglyceride levels can help control VLDL concentrations. -
Atherogenic Index
General Information
The Atherogenic Index of Plasma (AIP) is calculated and is a predictor of cardiovascular risk.
Possible Causes of Elevated Levels
• High Triglycerides with Low HDL: Common in metabolic syndrome.
• Insulin Resistance: Alters lipid metabolism.
• Obesity: Associated with unfavorable lipid profiles.
Possible Causes of Low Levels
• Healthy Lifestyle: Balanced diet and regular exercise.
• Genetic Factors: Favorable lipid metabolism.
Key Notes / Suggestions
• AIP is a useful marker for assessing the risk of atherosclerosis.
• Lifestyle interventions can significantly improve AIP values. -
LDL/HDL Ratio
General Information
The LDL/HDL ratio provides insight into the balance between “bad” and “good” cholesterol, aiding in cardiovascular risk assessment.
Possible Causes of Elevated Levels
• High LDL with Low HDL: Increases cardiovascular risk.
• Poor Diet and Sedentary Lifestyle: Negatively affect the ratio.
Possible Causes of Low Levels
• Low LDL with High HDL: Indicates a favorable lipid profile.
• Effective Lipid-Lowering Therapy: Improves the ratio.
Key Notes / Suggestions
• A lower LDL/HDL ratio is associated with reduced cardiovascular risk.
• Regular monitoring can guide therapeutic decisions. -
Triglycerides
General Information
Triglycerides are the main form of fat in the body, stored in adipose tissue and used for energy.
Possible Causes of Elevated Levels
• High-Fat Diets: Increase triglyceride levels.
• Alcohol Consumption: Elevates triglycerides.
• Uncontrolled Diabetes: Leads to hypertriglyceridemia.
Possible Causes of Low Levels
• Malabsorption Syndromes: Reduce triglyceride levels.
• Hyperthyroidism: Increases triglyceride clearance.
Key Notes / Suggestions
• Elevated triglycerides are a risk factor for pancreatitis and cardiovascular disease.
• Lifestyle modifications are the first-line treatment. -
Lactate Dehydrogenase (LDH)
General Information
LDH is an enzyme involved in energy production, present in various tissues including the heart, liver, and muscles.
Possible Causes of Elevated Levels
• Tissue Damage: Myocardial infarction, liver disease, or muscle injury.
• Hemolytic Anemia: Increases LDH levels.
Possible Causes of Low Levels
• Rare Genetic Disorders: LDH deficiency.
• Excessive Vitamin C Intake: May lower LDH levels.
Key Notes / Suggestions
• LDH levels are nonspecific and should be interpreted in the clinical context.
• Isoenzyme analysis can help identify the source of elevation. -
Creatine Kinase (CK)
General Information
CK is an enzyme found in the heart, brain, and skeletal muscles, playing a key role in energy metabolism.
Possible Causes of Elevated Levels
• Muscle Injury: Trauma or strenuous exercise.
• Myocardial Infarction: Increases CK levels.
• Statin Use: May cause muscle damage leading to elevated CK.
Possible Causes of Low Levels
• Reduced Muscle Mass: Decreases CK production.
• Sedentary Lifestyle: May lower CK levels.
Key Notes / Suggestions
• CK levels are useful in diagnosing muscle-related conditions.
• Serial measurements can monitor disease progression or response to therapy. -
Creatine Kinase MB Fraction (CK-MB)
General Information
CK-MB is an isoenzyme of CK found predominantly in cardiac muscle, used as a marker for myocardial infarction.
Possible Causes of Elevated Levels
• Acute Myocardial Infarction: Increases CK-MB levels.
• Cardiac Surgery or Trauma: Elevates CK-MB.
Possible Causes of Low Levels
• Normal Finding: Low levels are typical in healthy individuals.
Key Notes / Suggestions
• CK-MB levels rise within 4–6 hours of myocardial infarction onset.
• Troponin levels are now preferred for diagnosing acute coronary syndromes.
Liver Function - Metabolic Panel
For a proper liver function evaluation, a complete metabolic panel is required. Here is some basic information on their components.
-
Aspartate Aminotransferase (AST)
General Information
AST is an enzyme found in various tissues, including the liver, heart, muscles, kidneys, and brain. It plays a role in amino acid metabolism.
Possible Causes of Elevated Levels
• Liver Diseases: Hepatitis, cirrhosis, liver necrosis.
• Cardiac Conditions: Myocardial infarction.
• Muscle Disorders: Muscular dystrophy, trauma.
Possible Causes of Low Levels
• Vitamin B6 Deficiency: Affects enzyme activity.
• Chronic Kidney Disease: Reduced enzyme production.
Key Notes / Suggestions
• AST is not liver-specific; elevated levels should be interpreted alongside other tests. -
Alanine Aminotransferase (ALT)
General Information
ALT is predominantly found in the liver and is a more specific marker for hepatocellular injury.
Possible Causes of Elevated Levels
• Liver Conditions: Hepatitis, fatty liver disease.
• Medications: Statins, acetaminophen overdose.
Possible Causes of Low Levels
• Malnutrition: Decreased enzyme synthesis.
• Chronic Kidney Disease: Reduced enzyme production.
Key Notes / Suggestions
• ALT is more specific to liver injury compared to AST. -
AST/ALT Ratio
General Information
The AST/ALT ratio helps differentiate between various liver diseases.
Possible Causes of Elevated Ratio (>2)
• Alcoholic Liver Disease: Higher AST relative to ALT.
Possible Causes of Low Ratio (<1)
• Non-Alcoholic Fatty Liver Disease (NAFLD): Higher ALT relative to AST.
Key Notes / Suggestions
• A ratio >2 is suggestive of alcoholic liver disease; <1 may indicate NAFLD. -
Alkaline Phosphatase (ALP)
General Information
ALP is an enzyme found in the liver, bile ducts, and bone. It is involved in dephosphorylation processes.
Possible Causes of Elevated Levels
• Cholestasis: Bile duct obstruction.
• Bone Disorders: Paget’s disease, osteomalacia.
Possible Causes of Low Levels
• Malnutrition: Decreased enzyme production.
• Hypophosphatasia: Genetic disorder affecting ALP levels.
Key Notes / Suggestions
• Elevated ALP should be interpreted with GGT to determine hepatic vs. bone origin. -
Gamma-Glutamyl Transferase (GGT)
General Information
GGT is an enzyme involved in glutathione metabolism and is present in the liver, kidney, and pancreas.
Possible Causes of Elevated Levels
• Alcohol Consumption: Induces GGT synthesis.
• Cholestasis: Bile duct obstruction.
Possible Causes of Low Levels
• Hypothyroidism: Reduced enzyme activity.
• Genetic Factors: Familial low GGT levels.
Key Notes / Suggestions
• GGT is sensitive to alcohol intake and biliary obstruction. -
Total Bilirubin
General Information
Total bilirubin is the sum of direct (conjugated) and indirect (unconjugated) bilirubin, a breakdown product of hemoglobin.
Possible Causes of Elevated Levels
• Hemolysis: Increased breakdown of red blood cells.
• Liver Dysfunction: Impaired conjugation or excretion.
Possible Causes of Low Levels
• Not Clinically Significant: Low levels are typically not concerning.
Key Notes / Suggestions
• Elevated levels may cause jaundice; differentiation between direct and indirect is essential. -
Direct (Conjugated) Bilirubin
General Information
Direct bilirubin is bilirubin that has been conjugated in the liver, making it water-soluble for excretion.
Possible Causes of Elevated Levels
• Cholestasis: Bile duct obstruction.
• Hepatitis: Impaired excretion.
Possible Causes of Low Levels
• Not Clinically Significant: Low levels are typically not concerning.
Key Notes / Suggestions
• Elevated direct bilirubin indicates post-hepatic causes of jaundice. -
Indirect (Unconjugated) Bilirubin
General Information
Indirect bilirubin is unconjugated and not water-soluble, resulting from hemoglobin breakdown.
Possible Causes of Elevated Levels
• Hemolytic Anemia: Increased red blood cell destruction.
• Gilbert’s Syndrome: Reduced conjugation capacity.
Possible Causes of Low Levels
• Not Clinically Significant: Low levels are typically not concerning.
Key Notes / Suggestions
• Elevated indirect bilirubin suggests pre-hepatic causes of jaundice. -
Total Proteins
General Information
Total protein measures the combined levels of albumin and globulins in the blood.
Possible Causes of Elevated Levels
• Chronic Inflammation: Increased globulin production.
• Dehydration: Hemoconcentration.
Possible Causes of Low Levels
• Liver Disease: Reduced protein synthesis.
• Malnutrition: Decreased intake of amino acids.
Key Notes / Suggestions
• Total protein levels provide insight into nutritional and hepatic status. -
Albumin
General Information
Albumin is the most abundant plasma protein, synthesized by the liver, and maintains oncotic pressure.
Possible Causes of Elevated Levels
• Dehydration: Hemoconcentration.
Possible Causes of Low Levels
• Liver Disease: Impaired synthesis.
• Nephrotic Syndrome: Protein loss through kidneys.
Key Notes / Suggestions
• Hypoalbuminemia is a marker of chronic liver disease. -
Globulins
General Information
Globulins are a group of proteins involved in immune responses, including antibodies.
Possible Causes of Elevated Levels
• Chronic Infections: Increased antibody production.
• Multiple Myeloma: Monoclonal gammopathy.
Possible Causes of Low Levels
• Immunodeficiency: Reduced antibody production.
• Protein-Losing Enteropathy: Loss through the gastrointestinal tract.
Key Notes / Suggestions
• Alterations in globulin levels can indicate immune system disorders. -
Albumin/Globulin (A/G) Ratio
General Information
The A/G ratio compares the levels of albumin to globulins in the blood.
Possible Causes of Elevated Ratio
• Genetic Deficiencies: Low globulin production.
• Leukemia: Reduced globulin synthesis.
Possible Causes of Low Ratio
• Liver Disease: Decreased albumin production.
• Autoimmune Diseases: Increased globulin production.
Key Notes / Suggestions
• A low A/G ratio is often seen in chronic liver diseases.
Serum Electrolytes - Metabolic Panel
Electrolytes are essential minerals that help regulate nerve and muscle function, hydration, blood pH, and other vital processes. In a metabolic panel, the electrolyte panel typically includes measurements of sodium, potassium, chloride, phosphorus, calcium, and magnesium in the blood.
Abnormal levels can indicate dehydration, kidney disease, hormonal imbalances, and other underlying health conditions. Understanding each value in this section is key to interpreting the overall metabolic panel accurately.
-
Sodium (Na⁺)
General Information
Sodium is the primary extracellular cation, essential for maintaining fluid balance, nerve function, and muscle contractions. It is regulated by the kidneys through mechanisms involving aldosterone and antidiuretic hormone (ADH) .
Possible Causes of Elevated Levels (Hypernatremia)
• Dehydration: Excessive water loss without adequate replacement.
• Diabetes Insipidus: Impaired ADH function leading to water loss.
• Hyperaldosteronism: Increased sodium reabsorption .
Possible Causes of Low Levels (Hyponatremia)
• Syndrome of Inappropriate ADH Secretion (SIADH): Excessive water retention diluting sodium.
• Heart Failure or Cirrhosis: Fluid overload states.
• Diuretic Use: Especially thiazide diuretics .
Key Notes / Suggestions
• Rapid correction of sodium imbalances can lead to serious neurological complications; management should be gradual and monitored closely. -
Potassium (K⁺)
General Information
Potassium is the main intracellular cation, vital for cellular function, nerve impulse transmission, and muscle contraction. The kidneys are primarily responsible for potassium excretion .
Possible Causes of Elevated Levels (Hyperkalemia)
• Chronic Kidney Disease: Impaired excretion.
• Medications: ACE inhibitors, ARBs, potassium-sparing diuretics.
• Cellular Destruction: Hemolysis, rhabdomyolysis .
Possible Causes of Low Levels (Hypokalemia)
• Diuretic Use: Especially loop and thiazide diuretics.
• Vomiting or Diarrhea: Gastrointestinal losses.
• Hyperaldosteronism: Increased renal excretion .
Key Notes / Suggestions
• Both hyperkalemia and hypokalemia can cause life-threatening cardiac arrhythmias; prompt diagnosis and treatment are essential. -
Chloride (Cl⁻)
General Information
Chloride is the major extracellular anion, playing a crucial role in maintaining acid-base balance and osmotic pressure. It is closely associated with sodium and is regulated by the kidneys .
Possible Causes of Elevated Levels (Hyperchloremia)
• Dehydration: Concentrated serum chloride.
• Metabolic Acidosis: Loss of bicarbonate leading to relative chloride increase.
• Renal Tubular Acidosis: Impaired bicarbonate reabsorption .
Possible Causes of Low Levels (Hypochloremia)
• Vomiting: Loss of hydrochloric acid.
• Metabolic Alkalosis: Excess bicarbonate.
• Diuretic Use: Especially loop diuretics .
Key Notes / Suggestions
• Chloride imbalances often accompany sodium and acid-base disturbances; assessment should consider the overall electrolyte and acid-base status. -
Phosphorus (Phosphate, PO₄³⁻)
General Information
Phosphorus is essential for energy production, bone mineralization, and cellular signaling. It is absorbed in the gut and excreted by the kidneys, regulated by parathyroid hormone (PTH) .
Possible Causes of Elevated Levels (Hyperphosphatemia)
• Chronic Kidney Disease: Reduced excretion.
• Hypoparathyroidism: Decreased PTH leads to phosphate retention.
• Excessive Intake: High-phosphate diets or supplements .
Possible Causes of Low Levels (Hypophosphatemia)
• Malnutrition or Refeeding Syndrome: Rapid cellular uptake.
• Alcoholism: Poor intake and absorption.
• Hyperparathyroidism: Increased renal excretion .
Key Notes / Suggestions
• Severe hypophosphatemia can lead to muscle weakness, respiratory failure, and hemolysis; monitoring is crucial in at-risk populations. -
Calcium (Ca²⁺)
General Information
Calcium is vital for bone health, muscle function, nerve transmission, and blood clotting. Serum calcium levels are regulated by PTH, vitamin D, and calcitonin .
Possible Causes of Elevated Levels (Hypercalcemia)
• Primary Hyperparathyroidism: Excess PTH increases calcium.
• Malignancy: PTH-related peptide secretion.
• Vitamin D Toxicity: Increased absorption .
Possible Causes of Low Levels (Hypocalcemia)
• Hypoparathyroidism: Reduced PTH.
• Vitamin D Deficiency: Impaired absorption.
• Chronic Kidney Disease: Decreased activation of vitamin D .
Key Notes / Suggestions
• Corrected calcium levels should account for albumin concentrations; ionized calcium measurement may be necessary in certain clinical scenarios. -
Magnesium (Mg²⁺)
General Information
Magnesium is involved in over 300 enzymatic reactions, including energy production and nucleic acid synthesis. It is absorbed in the intestine and excreted by the kidneys .
Possible Causes of Elevated Levels (Hypermagnesemia)
• Renal Failure: Impaired excretion.
• Excessive Intake: Magnesium-containing antacids or laxatives .
Possible Causes of Low Levels (Hypomagnesemia)
• Chronic Alcoholism: Poor intake and increased renal losses.
• Gastrointestinal Losses: Diarrhea, malabsorption.
• Diuretic Use: Especially loop diuretics .
Key Notes / Suggestions
• Magnesium levels should be monitored in patients with arrhythmias, neuromuscular symptoms, or those receiving diuretics.
Pancreatic Function - Metabolic Panel
The pancreatic panel focuses on enzymes that reflect the health and function of the pancreas—primarily amylase and lipase. These enzymes play a critical role in digestion and are commonly measured when pancreatitis or other pancreatic disorders are suspected.
As part of a broader metabolic panel, evaluating pancreatic markers helps detect inflammation, obstruction, or other underlying conditions that may not present with obvious symptoms.
-
Amylase
General Information
Amylase is a digestive enzyme primarily produced by the pancreas and salivary glands. It plays a crucial role in carbohydrate digestion by breaking down starches into sugars. In clinical settings, serum amylase levels are measured to assess pancreatic function.
Possible Causes of Elevated Levels
• Acute Pancreatitis: Elevated serum amylase is a hallmark of acute pancreatitis, typically rising within hours of onset and returning to normal within 3–5 days .
• Salivary Gland Disorders: Conditions like mumps can increase salivary amylase levels.
• Renal Insufficiency: Reduced clearance can lead to elevated serum amylase.
• Gastrointestinal Conditions: Perforated ulcers or intestinal obstruction may also cause elevations.
Possible Causes of Low Levels
• Chronic Pancreatitis: Progressive pancreatic damage can lead to decreased enzyme production .
• Pancreatic Insufficiency: Conditions like cystic fibrosis or advanced diabetes may result in reduced amylase levels .
Key Notes / Suggestions
• Amylase levels should be interpreted alongside clinical findings and other diagnostic tests, as elevations are not specific to pancreatic disorders. -
Lipase
General Information
Lipase is an enzyme predominantly produced by the pancreas, essential for the digestion of dietary fats. It hydrolyzes triglycerides into free fatty acids and glycerol, facilitating fat absorption in the small intestine.
Possible Causes of Elevated Levels
• Acute Pancreatitis: Serum lipase levels rise within 4–8 hours of onset, peak at 24 hours, and remain elevated longer than amylase .
• Pancreatic Tumors: Certain neoplasms can increase lipase production.
• Renal Failure: Impaired clearance can lead to elevated serum lipase.
• Other Conditions: Gastrointestinal perforation, cholecystitis, and celiac disease may also cause elevations .
Possible Causes of Low Levels
• Chronic Pancreatitis: Long-standing inflammation can reduce enzyme secretion.
• Pancreatic Insufficiency: Conditions leading to exocrine dysfunction may decrease lipase levels .
Key Notes / Suggestions
• Lipase is more specific to pancreatic pathology than amylase and is considered a more reliable marker for acute pancreatitis.
Iron Metabolism - Metabolic Panel
The iron metabolism panel assesses how the body absorbs, transports, and stores iron—an essential mineral for oxygen transport and energy production. It typically includes tests such as serum iron, total iron-binding capacity (TIBC), transferrin saturation, and unsaturated iron-binding capacity (UIBC).
Although not always part of a basic metabolic panel, these tests are frequently added when evaluating symptoms like fatigue, weakness, or suspected anemia. Interpreting iron-related values is key to identifying deficiencies, overload conditions, or chronic disease-related disturbances.
-
Serum Iron
General Information
Serum iron measures the amount of circulating iron bound to transferrin, reflecting immediate iron availability for erythropoiesis and cellular metabolism.
Possible Causes of Elevated Levels
• Hemochromatosis: Genetic disorder leading to excessive iron absorption.
• Iron Overload: Due to repeated blood transfusions or excessive supplementation.
• Acute Hepatitis: Release of stored iron from hepatocytes.
Possible Causes of Low Levels
• Iron Deficiency Anemia: Due to inadequate intake or chronic blood loss.
• Chronic Inflammatory States: Iron sequestration within macrophages.
Key Notes / Suggestions
• Serum iron levels can fluctuate daily; interpretation should consider diurnal variation and recent dietary intake. -
Total Iron-Binding Capacity (TIBC)
General Information
TIBC measures the blood’s capacity to bind iron with transferrin, indirectly reflecting transferrin levels.
Possible Causes of Elevated Levels
• Iron Deficiency: Increased transferrin production to maximize iron transport.
• Pregnancy: Elevated estrogen levels stimulate transferrin synthesis.
Possible Causes of Low Levels
• Chronic Diseases: Inflammatory cytokines suppress transferrin production.
• Liver Disease: Impaired synthesis of transferrin.
Key Notes / Suggestions
• TIBC is a useful marker in differentiating types of anemia. -
Transferrin Saturation
General Information
Transferrin saturation is the percentage of transferrin binding sites occupied by iron, calculated as (Serum Iron / TIBC) × 100.
Possible Causes of Elevated Levels
• Iron Overload Disorders: Such as hemochromatosis.
• Hemolytic Anemia: Increased release of iron from destroyed erythrocytes.
Possible Causes of Low Levels
• Iron Deficiency Anemia: Reduced serum iron with elevated TIBC.
• Chronic Inflammatory States: Decreased serum iron with normal or low TIBC.
Key Notes / Suggestions
• Transferrin saturation is a sensitive marker for iron overload and deficiency. -
Unsaturated Iron-Binding Capacity (UIBC)
General Information
UIBC measures the reserve capacity of transferrin to bind additional iron, calculated as TIBC minus serum iron.
Possible Causes of Elevated Levels
• Iron Deficiency: Increased unbound transferrin sites.
• Pregnancy: Elevated transferrin levels increase UIBC.
Possible Causes of Low Levels
• Iron Overload: Saturated transferrin reduces unbound capacity.
• Chronic Diseases: Decreased transferrin synthesis lowers UIBC.
Key Notes / Suggestions
• UIBC complements TIBC and serum iron measurements in assessing iron status. -
Transferrin
General Information
Transferrin is a glycoprotein synthesized in the liver, responsible for iron transport in the bloodstream.
Possible Causes of Elevated Levels
• Iron Deficiency: Upregulated transferrin synthesis to enhance iron transport.
• Estrogen Therapy: Stimulates transferrin production.
Possible Causes of Low Levels
• Chronic Inflammatory States: Cytokine-mediated suppression of transferrin synthesis.
• Liver Disease: Impaired hepatic production of transferrin.
Key Notes / Suggestions
• Transferrin levels are influenced by nutritional status and liver function.
Immunoglobulin Profile - Metabolic Panel
The immunoglobulin profile measures key antibodies—IgA, IgM, and IgG—that play essential roles in the immune system’s defense against infections. While not part of a standard metabolic panel, these tests are crucial for evaluating immune function, diagnosing immunodeficiencies, autoimmune disorders, and certain chronic infections.
Assessing immunoglobulin levels provides valuable insight into the body’s ability to respond to disease and maintain immune balance.
-
Immunoglobulin A (IgA)
General Information
Immunoglobulin A (IgA) is predominantly found in mucosal areas such as the respiratory and gastrointestinal tracts, as well as in secretions like saliva, tears, and breast milk. It plays a crucial role in mucosal immunity by preventing the adherence of pathogens to epithelial cells, thereby inhibiting their entry and colonization.
Possible Causes of Elevated Levels
• Chronic infections: Persistent infections can stimulate increased IgA production.
• Autoimmune diseases: Conditions like rheumatoid arthritis may elevate IgA levels.
• Liver diseases: Cirrhosis and other hepatic conditions can lead to increased IgA.
Possible Causes of Low Levels
• Selective IgA deficiency: The most common primary immunodeficiency, characterized by undetectable levels of IgA.
• Genetic factors: Certain inherited conditions can result in low IgA production.
Key Notes / Suggestions
• IgA deficiency may be asymptomatic but can predispose individuals to recurrent mucosal infections.
• Elevated IgA levels should be interpreted in the context of clinical findings and other laboratory results. -
Immunoglobulin M (IgM)
General Information
Immunoglobulin M (IgM) is the first antibody produced in response to an antigen and is primarily found in the blood and lymphatic fluid. It plays a vital role in the initial stages of immunity by neutralizing pathogens and activating the complement system.
Possible Causes of Elevated Levels
• Acute infections: Recent exposure to pathogens can increase IgM levels.
• Waldenström’s macroglobulinemia: A type of cancer that leads to excessive IgM production.
• Autoimmune diseases: Conditions like systemic lupus erythematosus may elevate IgM.
Possible Causes of Low Levels
• Primary immunodeficiencies: Such as Hyper IgM syndrome, where class switching is impaired.
• Secondary immunodeficiencies: Resulting from treatments like chemotherapy or conditions like HIV.
Key Notes / Suggestions
• Elevated IgM levels in the absence of infection may warrant further investigation for lymphoproliferative disorders.
• Low IgM levels can compromise the body’s initial defense against infections. -
Immunoglobulin G (IgG)
General Information
Immunoglobulin G (IgG) is the most abundant antibody in the bloodstream and extracellular fluid. It provides long-term protection by neutralizing pathogens and is the only antibody capable of crossing the placenta to confer passive immunity to the fetus.
Possible Causes of Elevated Levels
• Chronic infections: Ongoing exposure to antigens can stimulate IgG production.
• Autoimmune diseases: Conditions like multiple sclerosis may elevate IgG levels.
• Monoclonal gammopathies: Such as multiple myeloma, characterized by excessive IgG production.
Possible Causes of Low Levels
• Primary immunodeficiencies: Like Common Variable Immunodeficiency (CVID), leading to decreased IgG.
• Protein-losing conditions: Such as nephrotic syndrome, where IgG is lost through urine.
Key Notes / Suggestions
• IgG levels are crucial for assessing immune competence and vaccine responses.
• Subclass analysis (IgG1, IgG2, IgG3, IgG4) can provide more detailed information in certain clinical scenarios.
1. Gounden, V. (2024). Renal Function Tests. StatPearls. Retrieved from https://www.ncbi.nlm.nih.gov/books/NBK507821/
2. Medscape. (2025). Blood Urea Nitrogen (BUN). Retrieved from https://emedicine.medscape.com/article/2073979-overview
3. National Kidney Foundation. (2023). Creatinine. Retrieved from https://www.kidney.org/kidney-topics/creatinine
4. Hosten, A. O. (1990). BUN and Creatinine. Clinical Methods. Retrieved from https://www.ncbi.nlm.nih.gov/books/NBK305/
5. Inker, L. A., et al. (2021). Measurement and Estimation of GFR for Use in Clinical Practice. American Journal of Kidney Diseases, 77(4), 486–497. https://doi.org/10.1053/j.ajkd.2020.09.019
6. Thomas, C. (2009). Renal Failure—Measuring the Glomerular Filtration Rate. Deutsches Ärzteblatt International, 106(51-52), 849–854. https://doi.org/10.3238/arztebl.2009.0849
7. Higgins, C. (n.d.). Urea and the clinical value of measuring blood urea concentration. Acute Care Testing. Retrieved from https://acutecaretesting.org/en/articles/urea-and-the-clinical-value-of-measuring-blood-urea-concentration
8. Shavit, L., et al. (2007). Acute Increase in Blood Urea Nitrogen Caused by Enteric Nutrition. Journal of the American Geriatrics Society, 55(7), 1160–1161. https://doi.org/10.1111/j.1532-5415.2007.01129.x
9. Andreev, E., et al. (1999). A rise in plasma creatinine that is not a sign of renal failure: which drugs can cause it? Journal of Internal Medicine, 246(3), 247–252. https://doi.org/10.1046/j.1365-2796.1999.00515.x
10. Thongprayoon, C., et al. (2016). Serum creatinine level, a surrogate of muscle mass, predicts mortality in critically ill patients. Journal of Thoracic Disease, 8(5), E305–E311. https://doi.org/10.21037/jtd.2016.03.95
11. Inker, L. A., et al. (2021). Measurement and Estimation of GFR for Use in Clinical Practice. American Journal of Kidney Diseases, 77(4), 486–497. https://doi.org/10.1053/j.ajkd.2020.09.019
12. Thomas, C. (2009). Renal Failure—Measuring the Glomerular Filtration Rate. Deutsches Ärzteblatt International, 106(51-52), 849–854. https://doi.org/10.3238/arztebl.2009.0849
13. MedlinePlus. (2024). Sodium Blood Test. Retrieved from https://medlineplus.gov/lab-tests/sodium-blood-test/
14. Mayo Clinic. (2025). Hyponatremia – Symptoms and causes. Retrieved from https://www.mayoclinic.org/diseases-conditions/hyponatremia/symptoms-causes/syc-20373711
15. MedlinePlus. (2024). Potassium Blood Test. Retrieved from https://medlineplus.gov/lab-tests/potassium-blood-test/
16. Cleveland Clinic. (2025). Hyperkalemia (High Potassium): Symptoms & Treatment. Retrieved from https://my.clevelandclinic.org/health/diseases/15184-hyperkalemia-high-blood-potassium
17. MedlinePlus. (2024). Chloride Blood Test. Retrieved from https://medlineplus.gov/lab-tests/chloride-blood-test/
18. Healthline. (2024). What Is Hyperchloremia (High Chloride Levels)? Retrieved from https://www.healthline.com/health/hyperchloremia
19. MedlinePlus. (2023). Phosphate in Blood. Retrieved from https://medlineplus.gov/lab-tests/phosphate-in-blood/
20. Cleveland Clinic. (2023). Hypophosphatemia: What It Is, Causes, Symptoms. Retrieved from https://my.clevelandclinic.org/health/diseases/24040-hypophosphatemia
21. MedlinePlus. (2024). Calcium Blood Test. Retrieved from https://medlineplus.gov/lab-tests/calcium-blood-test/
22. Mayo Clinic. (2024). Hypercalcemia – Symptoms and causes. Retrieved from https://www.mayoclinic.org/diseases-conditions/hypercalcemia/symptoms-causes/syc-20355523
23. MedlinePlus. (2023). Magnesium Blood Test. Retrieved from https://medlineplus.gov/lab-tests/magnesium-blood-test/
24. Cleveland Clinic. (2025). Hypermagnesemia: Causes, Symptoms & Treatment. Retrieved from https://my.clevelandclinic.org/health/diseases/hypermagnesemia
25. StatPearls. (2023). Hypomagnesemia. Retrieved from https://www.ncbi.nlm.nih.gov/books/NBK500003/
26. Pappan, N. (2024). Dyslipidemia. StatPearls. Retrieved from https://www.ncbi.nlm.nih.gov/books/NBK560891/
27. Weissglas-Volkov, D., & Pajukanta, P. (2010). Genetic causes of high and low serum HDL-cholesterol. Journal of Lipid Research, 51(8), 2032–2057. https://doi.org/10.1194/jlr.R003095
28. Pirahanchi, Y., & Sharma, S. (2023). Biochemistry, LDL Cholesterol. StatPearls. Retrieved from https://www.ncbi.nlm.nih.gov/books/NBK519561/
29. Casso, F. M. J., & Casso, F. M. J. (2022). Biochemistry, Very Low Density Lipoprotein. StatPearls. Retrieved from https://www.ncbi.nlm.nih.gov/books/NBK587400/
30. Millán, J., Pintó, X., Muñoz, A., Zúñiga, M., Rubiés-Prat, J., Pallardo, L. F., … & Mangas, A. (2009). Lipoprotein ratios: Physiological significance and clinical usefulness in cardiovascular prevention. Vascular Health and Risk Management, 5, 757–765. https://doi.org/10.2147/VHRM.S6268
31. Taha, E. M., & Taha, E. M. (2022). Association between Atherogenic Index and Cholesterol to HDL Ratio with Cardiovascular Disease Risk. Journal of Lipid Research. [DOI/URL not provided]
32. Lala, V., Zubair, M., & Minter, D. A. (2023). Liver Function Tests. In StatPearls. StatPearls Publishing. https://www.ncbi.nlm.nih.gov/books/NBK482489/
33. Lowe, D., & Sanvictores, T. (2023). Alkaline Phosphatase. In StatPearls. StatPearls Publishing. https://www.ncbi.nlm.nih.gov/books/NBK459201/
34. Whitfield, J. B. (2001). Gamma glutamyl transferase. Clinica Chimica Acta, 299(1-2), 1–23. https://pubmed.ncbi.nlm.nih.gov/11563810/
35. Hall, P. (2012). What is the Real Function of the Liver ‘Function’ Tests? The Ulster Medical Journal, 81(1), 30–36. https://pmc.ncbi.nlm.nih.gov/articles/PMC3609680/
36. Ruiz, A. R. G., et al. (2021). Measurement and clinical usefulness of bilirubin in liver disease. World Journal of Gastroenterology, 27(24), 3535–3551. https://pmc.ncbi.nlm.nih.gov/articles/PMC10197288/
37. Kalas, M. A., et al. (2021). Abnormal liver enzymes: A review for clinicians. World Journal of Hepatology, 13(11), 1688–1704. https://pmc.ncbi.nlm.nih.gov/articles/PMC8637680/
38. Chen, W., et al. (2022). Elevated AST/ALT ratio is associated with all‐cause mortality and cancer incidence. Journal of Clinical Laboratory Analysis, 36(1), e24356. https://onlinelibrary.wiley.com/doi/10.1002/jcla.24356
39. Lee, H. A., et al. (2021). Direct Bilirubin Is More Valuable than Total Bilirubin for Predicting Liver Cirrhosis. Gut and Liver, 15(1), 123–131. https://www.gutnliver.org/journal/view.html?doi=10.5009%2Fgnl20171
40. Hayden, K., & Van Heyningen, C. (2001). Measurement of Total Protein Is a Useful Inclusion in Liver Function Test Profiles. Clinical Chemistry, 47(4), 793–794. https://academic.oup.com/clinchem/article-abstract/47/4/793/5639133
41. Health.com. (2025). A/G Ratio Test Explained: What It Means for Your Health. Retrieved from https://www.health.com/ag-ratio-test-8621193
42. Akinfemiwa, O. (2023). Amylase. In StatPearls. StatPearls Publishing. https://www.ncbi.nlm.nih.gov/books/NBK557738/
43. Pirahanchi, Y. (2023). Biochemistry, Lipase. In StatPearls. StatPearls Publishing. https://www.ncbi.nlm.nih.gov/books/NBK537346/
44. Jalal, M., et al. (2023). What is the clinical significance of low serum amylase? Journal of Clinical Laboratory Analysis. https://pmc.ncbi.nlm.nih.gov/articles/PMC11106763/
45. Oh, H. C., et al. (2017). Low Serum Pancreatic Amylase and Lipase Values Are Associated with Chronic Pancreatitis. Gut and Liver, 11(6), 878–883. https://www.gutnliver.org/journal/view.html?doi=10.5009%2Fgnl17066
46. Chatterjee, A., et al. (2025). Clinical Evaluation of Patients with Elevated Serum Lipase. Digestive Diseases and Sciences. https://link.springer.com/article/10.1007/s10620-025-08929-9
47. Brooks, F. P. (1972). Testing Pancreatic Function. The New England Journal of Medicine, 286(6), 296–299. https://www.nejm.org/doi/full/10.1056/NEJM197202102860605
48. Faruqi, A. (2024). Iron-Binding Capacity. In StatPearls. StatPearls Publishing. https://www.ncbi.nlm.nih.gov/books/NBK559119/
49. Ogun, A. S. (2022). Biochemistry, Transferrin. In StatPearls. StatPearls Publishing. https://www.ncbi.nlm.nih.gov/books/NBK532928/
50. Pfeiffer, C. M., et al. (2017). Laboratory methodologies for indicators of iron status. American Journal of Clinical Nutrition, 106(Suppl 6), 1606S–1614S. https://pmc.ncbi.nlm.nih.gov/articles/PMC5701713/
51. Waldvogel-Abramowski, S., et al. (2014). Physiology of Iron Metabolism. Transfusion Medicine and Hemotherapy, 41(3), 213–221. https://pmc.ncbi.nlm.nih.gov/articles/PMC4086762/
52. Rusch, J. A., et al. (2023). Diagnosing iron deficiency: Controversies and novel metrics. Current Opinion in Hematology, 30(3), 158–165. https://www.sciencedirect.com/science/article/pii/S152168962300054X
53. Huebers, H. A., & Finch, C. A. (1984). Transferrin: Physiology and clinical implications. American Journal of Hematology, 16(1), 1–20. https://www.sciencedirect.com/science/article/pii/S0006497120837604
54. Åsberg, A., et al. (2021). Unsaturated iron binding capacity and transferrin saturation in the assessment of iron status. Scandinavian Journal of Clinical and Laboratory Investigation, 81(2), 137–141. https://pubmed.ncbi.nlm.nih.gov/33463393/
55. Patel, A. (2023). Biochemistry, Immunoglobulin A. In StatPearls. StatPearls Publishing. https://www.ncbi.nlm.nih.gov/books/NBK551516/
56. Sathe, A. (2022). Biochemistry, Immunoglobulin M. In StatPearls. StatPearls Publishing. https://www.ncbi.nlm.nih.gov/books/NBK555995/
57. Cleveland Clinic. (2025, June 12). Immunoglobulin G (IgG): Function, Tests & Disorders. https://my.clevelandclinic.org/health/body/igg
58. Woof, J. M., & Kerr, M. A. (2006). The function of immunoglobulin A in immunity. Immunology, 113(2), 175–177. https://pubmed.ncbi.nlm.nih.gov/16362985/
59. Liu, J., & Bohnsack, J. F. (2019). Role of the IgM Fc Receptor in Immunity and Tolerance. Frontiers in Immunology, 10, 529. https://www.ncbi.nlm.nih.gov/pmc/articles/PMC6438924/
60. Reynolds, H. Y. (1988). Immunoglobulin G and Its Function in the Human Respiratory Tract. Mayo Clinic Proceedings, 63(2), 161–174. https://www.mayoclinicproceedings.org/article/S0025-6196(12)64949-0/fulltext
61. Tiwari, V. (2023). Rheumatoid Factor. In StatPearls. StatPearls Publishing. https://www.ncbi.nlm.nih.gov/books/NBK532898/
62. Mayo Clinic. (2023). Rheumatoid factor test. https://www.mayoclinic.org/tests-procedures/rheumatoid-factor/about/pac-20384800
63. MedlinePlus. (2025). Rheumatoid Factor (RF) Test. https://medlineplus.gov/lab-tests/rheumatoid-factor-rf-test/
64. Arthritis Foundation. (n.d.). High & Low Uric Acid Symptoms: How to Stay in a Safe Range. https://www.arthritis.org/diseases/more-about/high-low-uric-acid-symptoms-how-stay-in-safe-range
65. University of Washington Division of Rheumatology. (n.d.). Gout. https://rheumatology.uw.edu/patient-care/patient-information-portal/gout
66. Pope, J. E. (2021). C-reactive protein and implications in rheumatoid arthritis and associated comorbidities. Reumatologia, 59(4), 201–210. https://www.sciencedirect.com/science/article/pii/S004901722030290067. Mayo Clinic. (2025). C-reactive protein test. https://www.mayoclinic.org/tests-procedures/c-reactive-protein-test/about/pac-20385228
68. MedlinePlus. (2025). C-Reactive Protein (CRP) Test. https://medlineplus.gov/lab-tests/c-reactive-protein-crp-test/
69. WebMD. (2025). What to Know About Antistreptolysin O Titer. https://www.webmd.com/oral-health/what-to-know-antistreptolysin-o-titer
70. Medscape. (2025). Antistreptolysin O Titer. https://emedicine.medscape.com/article/2113540-overview